What Is a Tolerance Stack-Up?
A tolerance stack-up is a method used to calculate the cumulative effect of part tolerances in an assembly. It tells you whether parts will still fit and function properly when every feature is manufactured with some deviation from its nominal value.
Every dimension on a part has a tolerance—a range within which it's allowed to vary. When multiple parts fit together, these small variations can add up in ways that cause parts to misalign, bind, or have excessive gaps.

When Do You Need a Stack-Up Analysis?
Any time you're designing for:
- Fit: press fits, clearance fits, slip fits, snap fits
- Alignment: holes across multiple parts, optical paths, sensor views
- Gaps: sealing zones, visible flushness, enclosure interfaces
- Motion: linkages, cams, shafts, or any mechanism with clearances
- Function: preload, clamping, gear meshing, stiffness
If a part needs to align, mate, or move reliably with another, and there is dimensional variation, you probably need a stack-up.
Terminology
- Nominal: The target dimension you specify on a drawing.
- Tolerance: The allowable deviation from the nominal.
- Allowance: The minimum intended clearance or interference between parts.
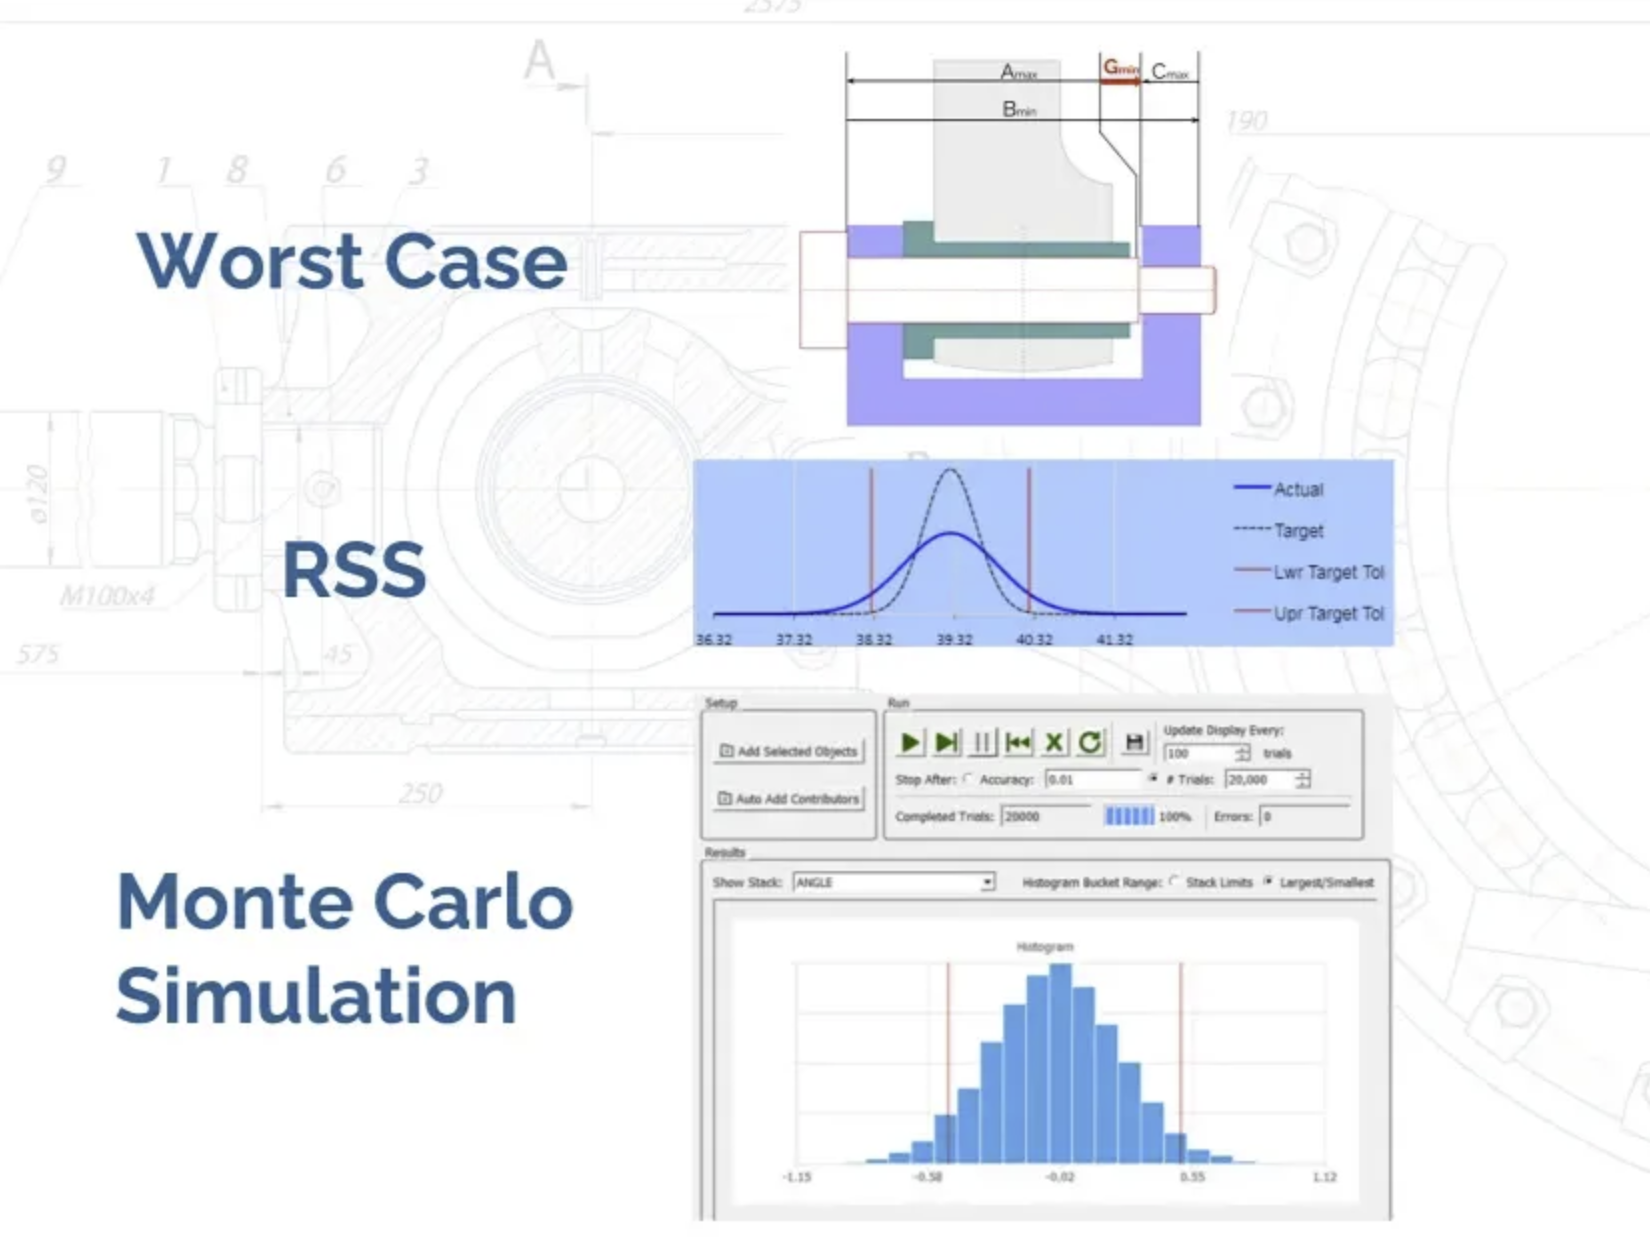
- Worst Case Stack-Up: A method where all tolerances are considered at their limits.
- RSS (Root Sum Square) Stack-Up: A statistical method assuming normal distribution.
- Monte Carlo Stack-Up: A simulation-based method using randomized sampling.
- Stack Path: The set of dimensions that affect the feature or gap you're analyzing.
How to Perform a Basic Stack-Up Analysis
Step 1: Define the Functional Requirement
Before you can perform a tolerance stack-up, you need to clearly define the specific functional requirement you're analyzing. A functional requirement is a measurable condition that must be met for the product or assembly to perform correctly. It usually relates to things like alignment, fit, gap, flushness, or motion.
Ask yourself: What needs to happen for this assembly to work?
- Does a pin need to fit into a hole without binding?
- Is there a required clearance or interference between mating parts?
- Must a sensor or lens align precisely with a target area?
- Should a panel sit flush with another component?
What you’re checking is not every tolerance in the assembly—it’s one critical outcome that results from the interaction of multiple features.
Be specific. The more clearly you define the functional limit (e.g., "gap must be 1.0 ± 0.2 mm"), the more accurate and useful your stack-up analysis will be. You’re not analyzing the whole assembly—you’re analyzing one functional condition.
Step 2: Create a Stack Path


Start by identifying the path of features and dimensions that influence the functional requirement you're analyzing. This is typically a linear (1D) path from one feature to another, such as the distance between two mounting faces or the total height of a set of stacked components.
To build your stack path:
- Sketch a simplified cross-section of the assembly.
- Draw an arrow from the starting point to the end point of the function you're evaluating.
- List all the dimensions that fall along this path and influence it directly.
This method works well for flat or linear assemblies, but stack paths often extend into 2D or 3D when dealing with more complex situations, such as:
- Angled features (e.g. parts mating at a bevel or inclined plane)
- Hole alignment across multiple components where X, Y, and angular tolerances interact
- Assemblies with rotational elements like gears or cams, where radial or angular displacement matters
In these cases, you’ll need to resolve the geometry into components along the stack direction using trigonometry or coordinate projection. A clear sketch or CAD section view is especially helpful for visualizing and validating the path before you start doing the math.
This is usually 1D (linear in one direction), but can expand to 2D or 3D when dealing with angled or compound geometry.
Step 3: Build a Stack-Up Table
For each contributing feature:
- Feature name
- Nominal dimension
- Tolerance (±)
- Direction (➕ if it adds to the stack, ➖ if it subtracts)
- Angle relative to stack direction (if not orthogonal)
Simple Example:

What is Direction?
Direction refers to the effect of a feature on the total stack path:
- If increasing the feature size increases the stack total: positive
- If increasing the feature size decreases the stack total: negative
This is not the same as the ± tolerance. It’s about what happens to the stack when the feature gets bigger or smaller.
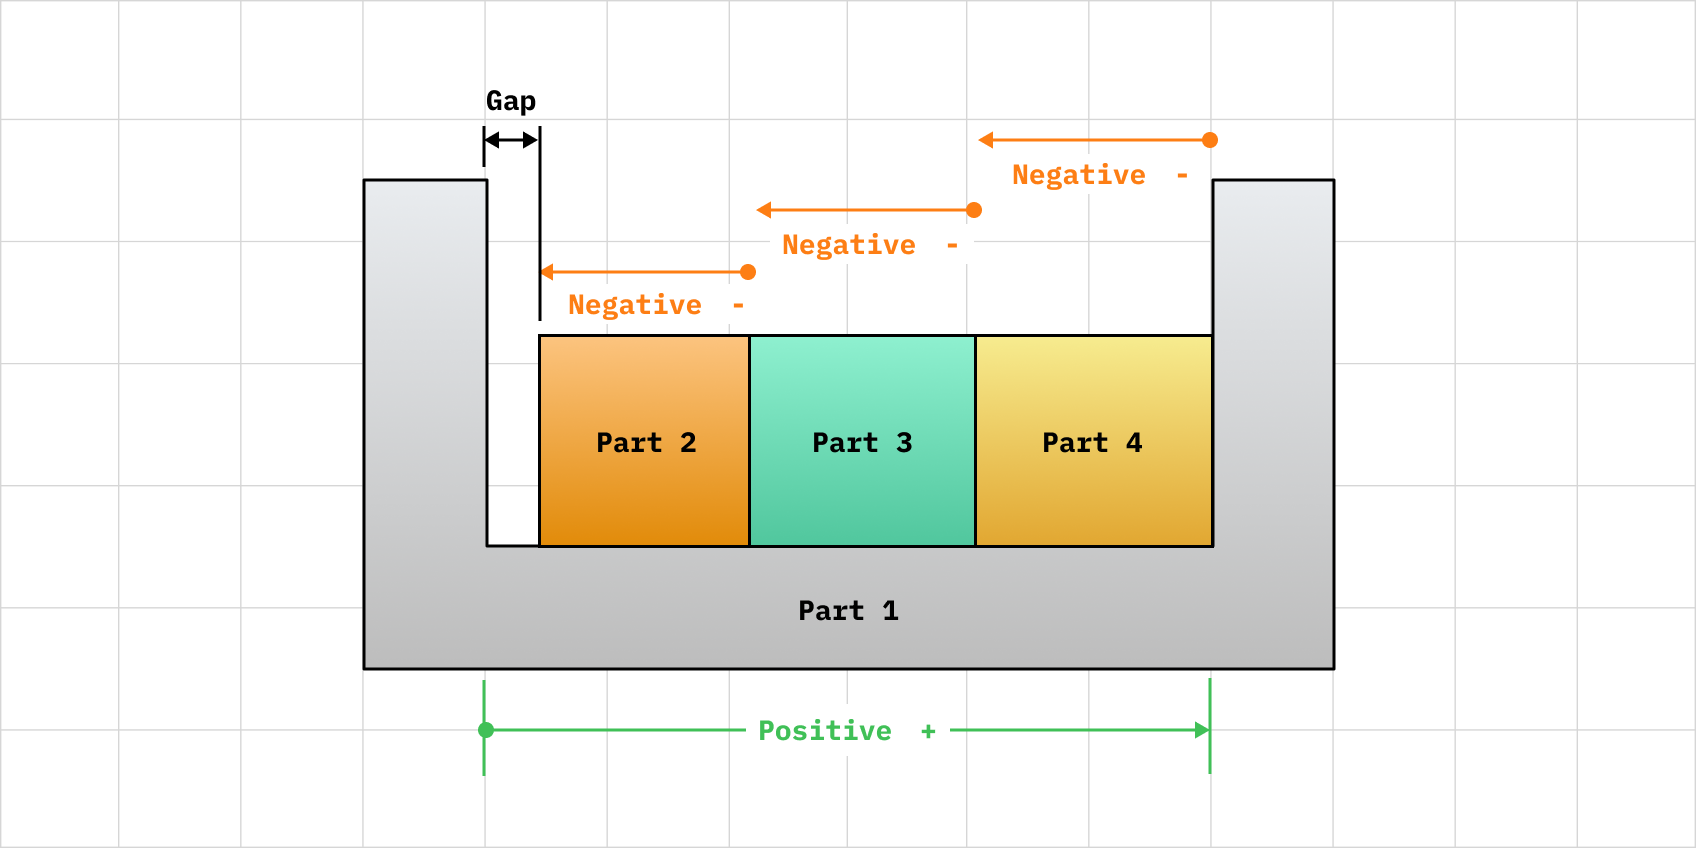
Example:
- Housing depth: bigger depth = bigger total gap → positive
- Lid thickness: bigger lid = smaller gap → negative
Direction affects how tolerances add or subtract in both worst-case and statistical methods.
Step 4: Project Angled Features (if needed)

If any of the contributing features in your stack path are not perfectly aligned with the direction you're analyzing (e.g., horizontal or vertical), you'll need to project their influence onto the axis of interest. This is especially important when dealing with angled holes, chamfers, tilted parts, or surfaces that can rotate or shift due to angular tolerances.
To do this, you convert the off-axis variation into a component along the stack direction:
- Linear features at an angle (e.g., diagonal blocks or pins): Use cosine to project the tolerance:
- Effective Tolerance = Tolerance × cos(θ), where θ is the angle between the feature's orientation and the stack direction.
- Rotational or tipping effects (e.g., perpendicularity or angular error): Use tangent to estimate how much a surface shifts due to tilt:
- Offset = Length × tan(θ), where Length is the distance from the rotation axis.
This ensures that the actual effect on your functional requirement is correctly represented in your calculations.
Update your stack-up table to include an "Effective Tolerance" column that reflects these projected values. This step is critical for accuracy in 2D or 3D stack-ups and often overlooked when tolerances are applied to features with angular relationships.
Once you've built your table and projected any angled features, you can now perform your stack-up analysis using one of the three methods below.
Step 5: Calculate Stack-Up
Pick the stack-up method most appropriate for your situation. There are 3 common types:
- Worst-Case stack-up: ideal for safety-critical designs where failure at the limits is unacceptable and 100% interchangeability is required.
- RSS (Root Sum Square) stack-up: ideal when you’re optimizing for manufacturability and want a realistic, not overly conservative, view of how much variation your assembly will likely see.
- Monte Carlo stack-up: ideal complex or nonlinear assemblies where statistical behavior matters more than extremes.
5A. Worst-Case Stack-Up (Use when failure is unacceptable)
Worst-Case stack-up: is a conservative method that adds all tolerance extremes together to determine the maximum possible variation in an assembly—ideal for safety-critical designs where failure at the limits is unacceptable and 100% interchangeability is required.
When to use: Safety-critical designs, interfaces with zero tolerance for failure, or when functional clearance must always be guaranteed.
Steps:
- Add all nominal dimensions algebraically based on direction.
- Sum all tolerances additively regardless of sign.
- Calculate total range:
- Max Stack = Nominal + Total Tolerance
- Min Stack = Nominal - Total Tolerance
Outcome: Gives the full possible range. Most conservative. Often over-restricts manufacturing.
5B. RSS (Root Sum Square) Stack-Up (Use when variation is random and process is capable)
RSS (Root Sum Square) stack-up: is a statistical method that combines tolerances by squaring them, summing them, and taking the square root—helping you determine the most likely variation in an assembly when all dimensions vary independently under normal manufacturing conditions. RSS is ideal when you’re optimizing for manufacturability and want a realistic, not overly conservative, view of how much variation your assembly will likely see.
When to use: General-purpose mechanical assemblies, when tolerances are moderate and the process is well-controlled (Cpk > 1.33).
Steps:
- Square each effective tolerance value.
- Sum the squared tolerances.
- Take the square root of the total:
- RSS Tolerance = √(T1² + T2² + T3²...)
- Total range = Nominal ± RSS Tolerance
Outcome: Less conservative than worst-case. Cost-efficient for capable processes.
5C. Monte Carlo Simulation (Use when stack path is complex or highly variable)
Monte Carlo stack-up: uses randomized sampling across tolerance ranges to simulate thousands of possible assembly outcomes—providing a highly realistic view of variation, especially useful in complex or nonlinear assemblies where statistical behavior matters more than extremes.
When to use: Complex assemblies, non-linear stack paths, 2D/3D tolerancing, or when statistical accuracy is critical.
Steps:
- Randomly sample each dimension within its tolerance range, assuming a distribution (normal or uniform).
- Apply direction and projection logic to each sample.
- Repeat thousands of times (10,000+ iterations).
- Analyze output distribution: mean, standard deviation, percent within spec.
Outcome: Most realistic prediction of assembly variation. Can identify risk zones and probability of failure.
6. Process Capability
Understanding Process Capability: Cp and Cpk
If you're using statistical methods like RSS or Monte Carlo to analyze tolerance stack-ups, you're making a big assumption: that the manufacturing process consistently produces parts close to nominal, with predictable variation. This is where Cp and Cpk come in.
- Cp (Process Capability Index): Measures the potential capability of a process to stay within tolerance limits, assuming it's perfectly centered. It's a measure of the spread only.
- Formula: Cp = (USL - LSL) / (6σ)
- USL = Upper Specification Limit
- LSL = Lower Specification Limit
- σ = Standard Deviation of the process
- If Cp = 1.33 or higher, the process is generally considered capable.
- Formula: Cp = (USL - LSL) / (6σ)
- Cpk (Process Capability Performance Index): Measures the actual capability of a process, factoring in how centered the process is. It accounts for both spread and shift.
- Formula: Cpk = min[(USL - µ) / 3σ, (µ - LSL) / 3σ]
- µ = Mean (average) of the process
- If Cpk < Cp, it means the process mean has drifted off center.
- Formula: Cpk = min[(USL - µ) / 3σ, (µ - LSL) / 3σ]
Why it matters: If Cp or Cpk is too low (e.g., < 1.0), your real-world parts may fall outside the tolerance limits more often than your stack-up analysis assumes. In that case, even a statistically "safe" stack-up could lead to functional failures. You should only use RSS or Monte Carlo methods if Cpk > 1.33. Otherwise, fall back on worst-case analysis or improve the process.

Quick guide:
- Cpk < 1.0 → High defect rate, do not use statistical stack-up
- Cpk > 1.33 → Acceptable for statistical methods
- Cpk > 1.67 → Excellent process, high reliability
In short: Cp and Cpk help you decide whether you can trust statistical tolerance analysis in the first place. Don’t skip this step — otherwise, you're building a precision house on a shaky foundation.
For more guidance on the different stack-up types and how to interpret them, check out this video.
Step 7: Compare to Functional Limits
Compare your stack-up result to the allowable limits for that function. Check whether the total variation calculated from your stack-up still allows the assembly to meet its required function—like keeping a gap within 1.0 ± 0.2 mm or aligning two holes within a certain offset. To do this you take your total tolerance range (from worst-case, RSS, or Monte Carlo) and see if it fits within that allowable envelope.
If it doesn’t, you’ll need to tighten key tolerances, shorten the stack path (remove or consolidate contributing features), or change the design to make it more tolerant of variation.
Step 8: Success!

What If the Stack-Up Fails?
Even with a careful analysis, sometimes your calculated stack-up range doesn’t meet the functional requirement. That doesn't mean your design is doomed — it just means you need to iterate smartly.
Here are practical strategies to bring the stack into spec:
- Re-center the Nominals: If the stack’s mean value is outside the target range, shift the nominal values of key dimensions to better align with your functional midpoint. This is often the lowest-effort fix.
- Tighten High-Impact Tolerances: Not all tolerances contribute equally to the stack variation. Use sensitivity analysis or intuition to identify which features have the largest effect — typically those with the largest tolerances or closest to the function. Tightening just one of these can dramatically improve the result.
- Use a Better Process: If you need to reduce variation, upgrading the manufacturing method might be necessary. For example, switching from manual machining to CNC, grinding, or wire EDM can produce tighter tolerances — but at a cost. Every process change has implications for time, tooling, and budget, so choose wisely.
- Add Adjustability: Instead of forcing perfection from manufacturing, introduce design features that absorb variation. Slots, oversized holes, shims, and floating fasteners can allow parts to self-align during assembly. This shifts the burden from the machine shop to the design.
- Shorten the Stack Path: Every dimension you add to the stack path increases potential variation. If possible, simplify the stack by combining features, redefining your functional requirement, or referencing dimensions from a more stable datum. The fewer contributors, the smaller the stack.
- Use Datums More Intelligently: Rethink how you’re locating features. A well-chosen datum structure can lock down critical relationships while ignoring irrelevant ones. Aligning your datum scheme with the real-world assembly conditions often reduces the effective stack range and makes inspection more meaningful.** Better datum selection can drastically reduce variation.
What About GD&T?
Using Geometric Dimensioning and Tolerancing (GD&T) simplifies stack-ups by:
- Replacing coordinate dimensions with basic dimensions (no tolerance)
- Controlling location via position tolerance in a feature control frame
- Referencing datums that mimic assembly conditions
This removes ambiguity, reduces tolerance stacking, and clarifies how parts are inspected. For example, a bolt hole pattern dimensioned with true position and datums avoids the multi-variable stack-up from coordinate X/Y/angle tolerances.

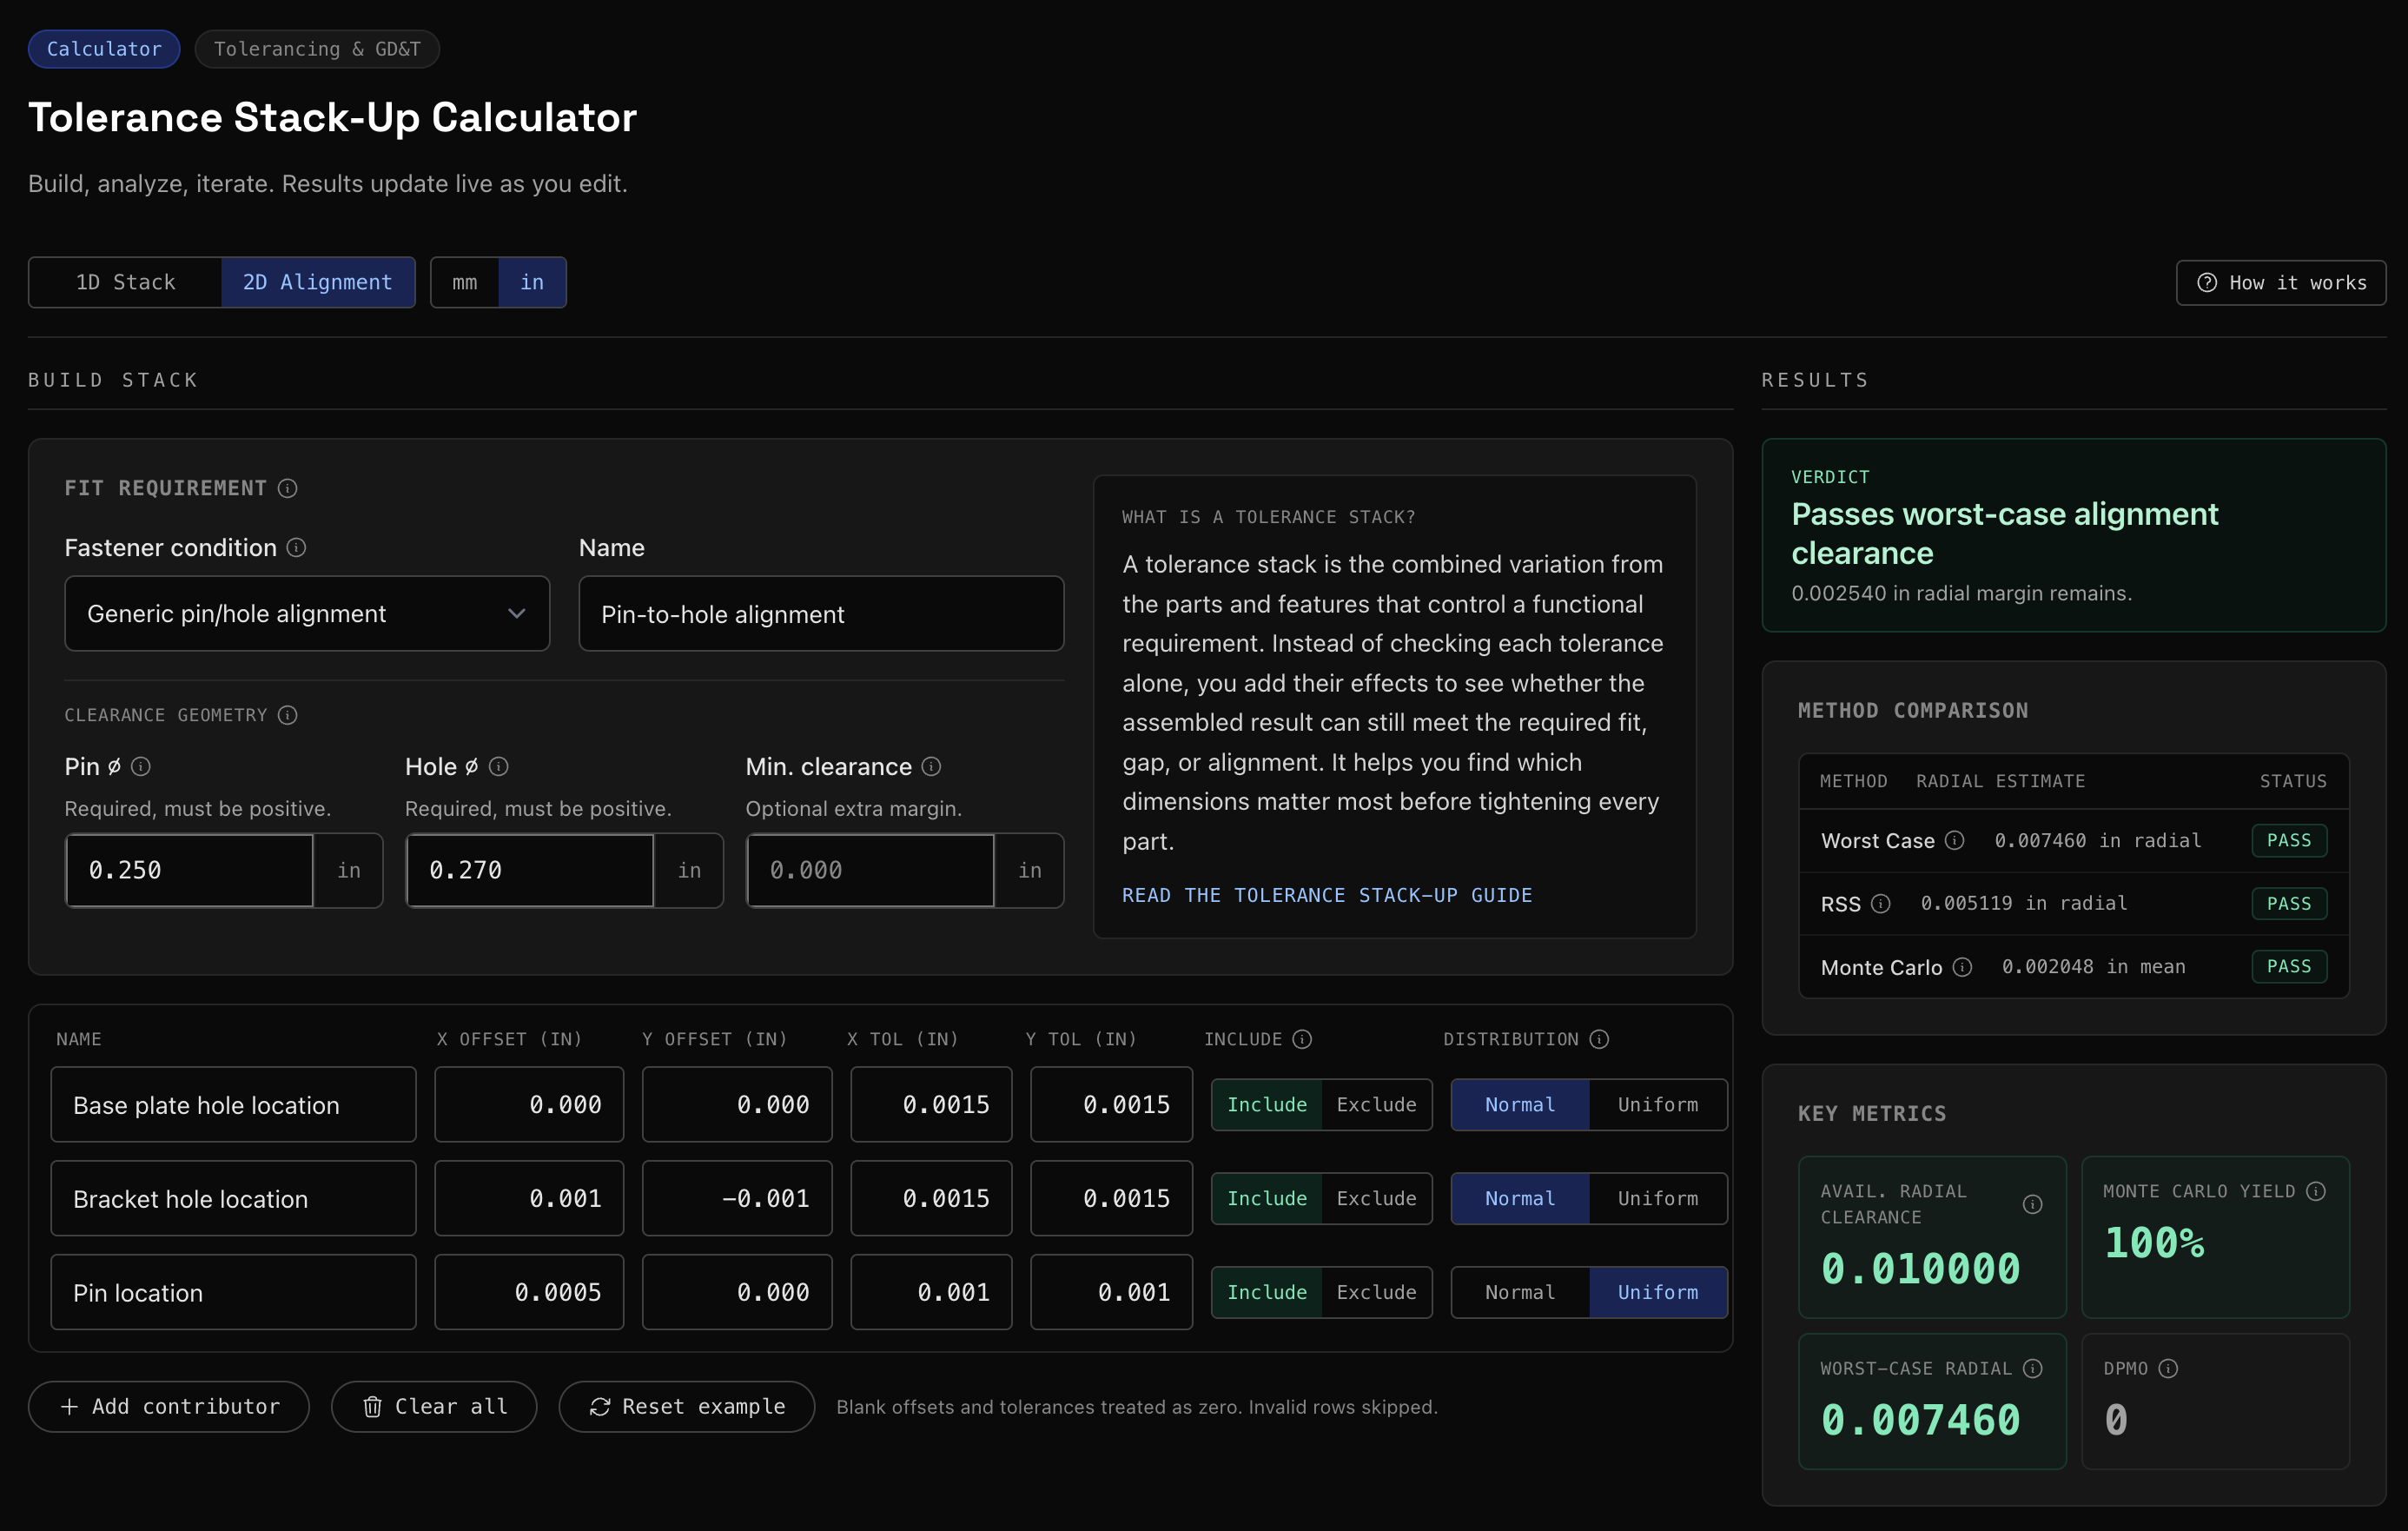
Make Tolerance Stack-ups Easier
Still wrapping your head around tolerance stack-ups? Try our interactive calculator to quickly analyze your assembly, understand worst-case vs. RSS conditions, and identify where your tolerance budget is going. No spreadsheets required. Click Here
Final Thought
Tolerance stack-up analysis isn’t a luxury. It’s a core design tool. It keeps your parts from binding, misaligning, rattling, or failing silently in the field. Whether you're designing a drone, a dental tool, or a dishwasher hinge—mastering stack-ups means fewer surprises, smoother assemblies, and less time apologizing to the machine shop.
And if you’re tired of doing it all in Excel, let’s talk. We’re building tools to make this easier, faster, and less likely to induce rage.
ALSO, if you have any feedback on this article or any questions, shoot me an email at matthew@drafterinc.com, I'd love to hear from you!
Useful Video on Tolerance Stack-Ups from Dean Odell

REFERENCES:
- Worst Case, RSS and Monte Carlo Simulation Calculations for Tolerance Analysis. Enventive Engineering, https://enventive.com/tolerance-analysis-resources/worst-case-rss-and-monte-carlo-simulation-calculations-for-tolerance-analysis/. Accessed 16 May 2025.
- Tom H. “GD&T Tolerance Stack Up Analysis Explained | ASME Y14.5.” YouTube, uploaded by The Engineering Academy, 4 Jan. 2022, https://www.youtube.com/watch?v=6Cb-u0_VQ5s.
- Process Capability. Quality Assurance Solutions, https://www.quality-assurance-solutions.com/Process-Capability.html. Accessed 16 May 2025.
- Jesse Villarreal. “How to Perform Tolerance Stack Up Analysis (Worst Case + RSS).” YouTube, uploaded by Jesse Villarreal, 28 Oct. 2021, https://www.youtube.com/watch?v=PcDaJBzSK90.
- CQE Academy. “Process Capability Index (Cp and Cpk) | Cp vs Cpk Explained.” YouTube, uploaded by CQE Academy, 20 Sept. 2022, https://www.youtube.com/watch?v=H6St9mCKWuA.
- Quality Hub India. “Tolerance Stack Up Analysis Using RSS.” YouTube, uploaded by Quality Hub India, 2 Aug. 2021, https://www.youtube.com/watch?v=GSXZipWl0fU.
- Tolerance Stacking. Chan’s Machining, https://chansmachining.com/tolerance-stacking/. Accessed 16 May 2025.
- Tolerance Stack-Up. Eng-Tips Forums, https://www.eng-tips.com/threads/tolerance-stak-up.469246/. Accessed 16 May 2025.
- Tolerance Stack-Up Analysis of GD&T from Beginners to Stars. Udemy, https://www.udemy.com/course/tolerance-stack-up-analysis-of-gdt-from-beginners-to-stars/?couponCode=CP130525US. Accessed 16 May 2025.
- One-Dimensional Tolerance Analysis and Tolerance Stackup (Part 1). Newtonian World, https://newtonianworld.com/mechanical-design-engineering-topics/engineering-drawings/one-dimensional-tolerance-analysis-and-tolerance-stackup-part-1/. Accessed 16 May 2025.
- Tolerance Stack-Up Using Trigonometry. Dimensional Consulting, https://www.dimensionalconsulting.com/stack-using-trigonometry.html. Accessed 16 May 2025.
- Palahalli, Varun. “Tolerance Stack-Up Analysis Explained for a Dummy Part (2/2).” LinkedIn, https://www.linkedin.com/pulse/tolerance-stack-up-analysis-explained-dummy-part-22-varun-palahalli/. Accessed 16 May 2025.